I ran into a big problem recently in FNIStash – I realized that it was using way more memory than I thought it should. What followed was a couple weeks of arduous investigation and learning about Haskell. If you find your program has a memory leak that is not due to thunks, these tips might help you out. Note that this all applies to the de facto standard compiler, GHC.
Understanding memory usage
The first step to figuring out why your program is using a lot of memory is to measure it. You can enable profiling by compiling your program with the -prof and -rtsopts compilation flags. This enables profiling and allows you to control it from the RTS options passed from the command line when you run the program. For example,
MyProgram.exe +RTS -hy
will run the program and categorize memory usage by type. There are lots of categorization options available, such as by module or function.
When your program terminates, you’ll get a .hp file in the same directory as the executable. You can convert it to a viewable PS or PDF file using
hp2ps -e8in -c MyProgram.hp
ps2pdf MyProgram.ps
The result is something like this.
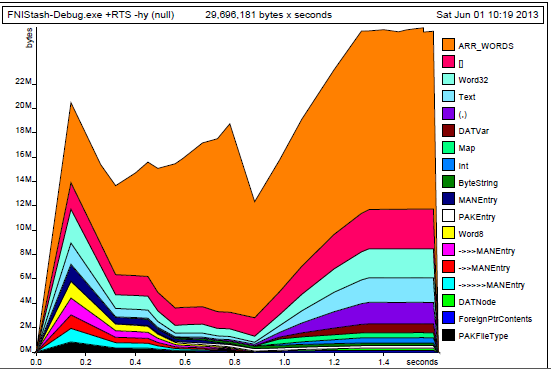
Memory profile of FNIStash categorize by type.
Here we can see that most of the memory is used up by ARR_WORDS, which is a backing type for ByteString and Text, among other things. Since FNIStash reads and parses an archive of binary files, this makes sense. However, the magnitude of the plot maxes out at around 25 MB. Why, then, does Windows report over 70 MB of memory used?

The discrepancy is due a couple of factors:
- First, the profiling doesn’t come for free. Compiling with the -prof option necessitates more memory just for reporting purposes. This requires approximately 30% more memory than usual. This overhead isn’t reported on the plot, but the OS sees it.
- The reported memory usage is only “live memory.” It doesn’t include old data that has not been collected by the garbage collector yet. In fact, in very loose terms, the default GHC GC waits until live data grows to the size of old data before collecting it. This means your program might use twice as much memory as needed. Note that when the garbage collector does run, it temporarily needs more space to reorganize the live data, so if a large amount of data is being collected at once, you can see memory usage (as reported by the OS) spike up.
- FNIStash, in particular, has some kind of memory leak. Right after start up, the OS memory usage was around 66 MB, but crept up to 70 MB after some minor GUI interaction. It’s actually unclear to me whether the leaked memory is reported in the plot.
So if we discount the leaked memory, then we have 66 MB / 1.3 / 2 = 25 MB, which is right in line with what the graph reports. Turning off profiling saves an easy 30% of OS memory usage, but what if you want to save more? How can the memory leak be fixed? Are you stuck with using twice as much memory as necessary?
Fixing the leak
Fixing the memory leak was a Sisyphean process of changing data types, adding strictness, and other futile efforts until I found the magic bullet: the threaded run time system. By default, Haskell uses a single-threaded RTS (meaning 1 OS thread) that can nonetheless provide concurrency. Indeed, FNIStash uses multiple threads to run the frontend and backend separately. The -threaded flag enables the multi-threaded RTS (multiple OS threads), and using it completely obliterated the terrible memory creep I was seeing in the Task Manager. I don’t know why this is. My suspicion is that the idle-time GC that comes with -threaded more aggressively cleans up. Given the number of cores on modern machines, I plan to make this my standard in the future.
Tuning the garbage collector
GHC enables the user to tune the garbage collector from the command line using RTS arguments. Here are the ones that I tested out. To use them, your program must be compiled with the -rtsopts flag. Additionally, and this is totally anecdotal on my part, it seems that having -prof enabled at the same time prevents any of these options from having an effect, so if you notice this you might want to compile without -prof.
- -c : This option changes the GC algorithm to use a slower compacting strategy instead of a copying strategy. What I think this mean is that instead of copying bytes around the heap when running GC, data gets compacted near where it already is. The end result is less heap usage. In my case, using this option yielded savings of around 10%.
- -Ffactor : Here “factor” is a value. By default, GHC uses a value of 2. This is the growth factor allowed before GC is run. If you make this smaller, GC will be run more often. However, this didn’t seem to help me out much.
- -Gx : If x = 1, this enables the single generation collector. I used this option without any others, and it actually increased my memory usage considerably and made my program much slower. I also tried G3, but that used a lot more memory as well.
In the end, I decided that killing the leak with the threaded RTS was enough for me. I don’t need extra memory savings by using -c for the moment. So I went from 70+ MB with a leak down to 48 MB with no leak by using -threaded and removing -prof. The real benefit, however, was learning more about GHC’s runtime system.
